GPT-5.6 without waste: the right model for each task Link to heading

Choosing an AI model is no longer a matter of picking a side. With the GPT-5.6 family, the decision has two independent controls: model size — Sol, Terra, or Luna — and reasoning effort. They change cost, latency, usage limits, and, most importantly, the likelihood that a task passes validation on the first attempt.
The practical question is which combination solves the problem without paying for intelligence you do not need. There is no fixed shopping list. Start from the task, observe how it fails, and increase capacity only when there is evidence that doing so lowers the total cost of delivery.
This guide combines OpenAI, Artificial Analysis, CursorBench, and benchmark methodology. Its conclusion is not that there is an absolute champion. Sol, Terra, and Luna occupy different places depending on the work, the harness, and the way you validate output.
Model size and effort are separate decisions Link to heading
Model size is not reasoning effort. Sol, Terra, and Luna are capability tiers. Reasoning effort controls how much the model explores alternatives and checks its work; available levels vary by product and model, but include options such as low, medium, high, and xhigh. max is the highest reasoning option exposed in OpenAI products; ultra is a different mechanism.
maxgives one agent more room to reason, test paths, and revise its strategy.ultragoes further: OpenAI says it coordinates four agents in parallel by default. It is orchestration, not another effort level or a magic “correct answer” button.
A ticket classifier may work well with Luna at low or medium effort. A bug that crosses several services may justify Sol at high effort. Treating both tasks as if the model name were the only variable is a costly mistake.
Token price shows scale; cost per accepted task decides the purchase Link to heading
OpenAI’s API list price per million tokens is US$5 input / US$30 output for Sol, US$2.50 / US$15 for Terra, and US$1 / US$6 for Luna. The launch page covers pricing, availability, and caching .
For a request with 10,000 input tokens and 5,000 output tokens, before caching and tools, list price is roughly US$0.20 for Sol, US$0.10 for Terra, and US$0.04 for Luna. That fivefold spread matters, but it does not answer the important question: how many attempts, corrections, and human reviews are needed before the task is acceptable?
Use token price to form a hypothesis, not to set policy. The useful metric is cost per accepted task: model, tools, waiting time, and human intervention until the work meets its acceptance criteria.
What the coding benchmarks actually measure Link to heading
The headline number in the launch is the Artificial Analysis Coding Agent Index v1.1: Sol scores 80, Terra 77.4, and Luna 74.6. That is meaningful, but it does not mean Luna is incapable or Terra is irrelevant.
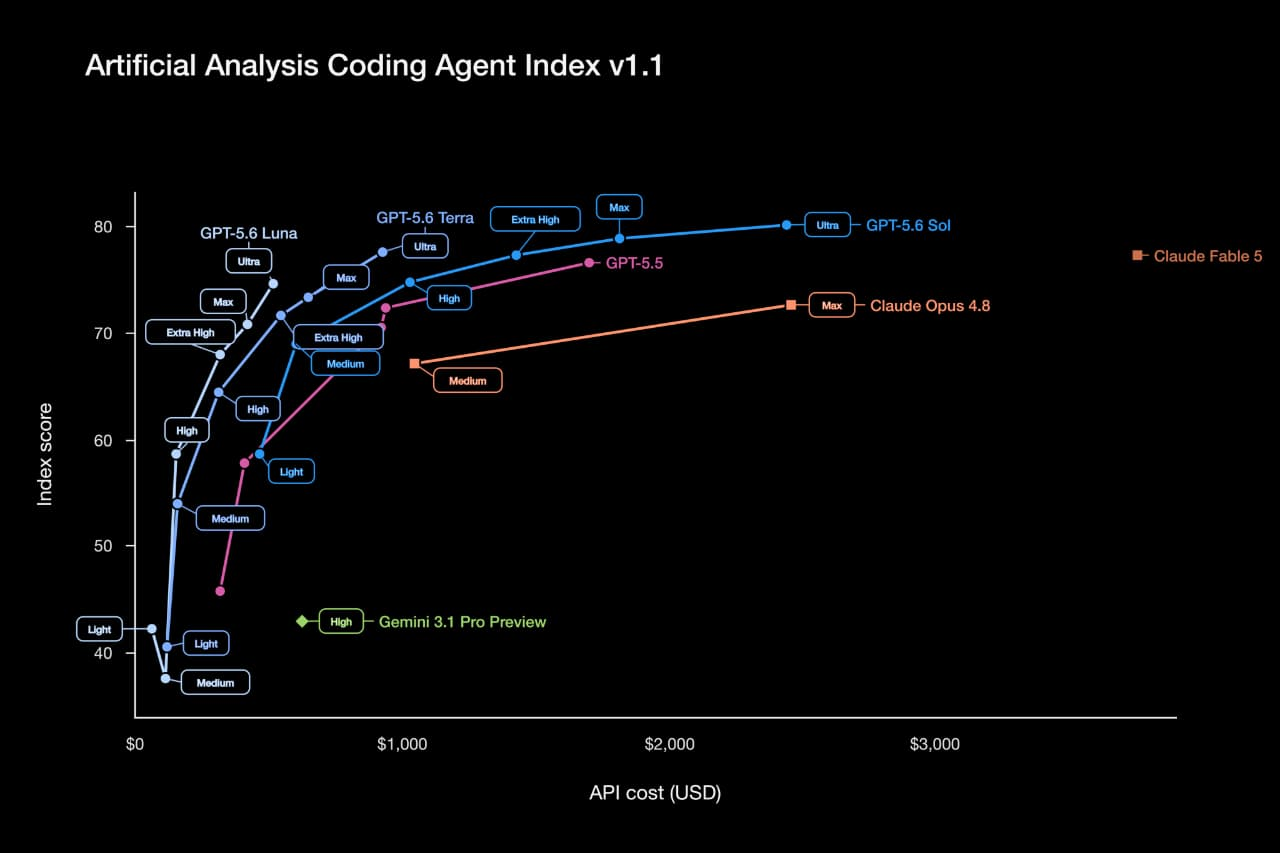
The Coding Agent Index is a composite measure, not an abstract measure of “coding IQ”. Read every point together with the method and the agent used. Source and methodology .
The index combines three agent evaluations:
- DeepSWE: 113 original, long-horizon software-engineering tasks. It tests repository exploration, multi-file change, and verification. DeepSWE’s methodology explains the design.
- Terminal-Bench v2: 84 tasks in the Artificial Analysis configuration. The agent must operate a real terminal environment and pass completion tests; plausible-looking code is not enough. The official 2.1 revision documents 89 tasks in the updated suite. Terminal-Bench describes the tasks and execution harness.
- SWE-Atlas-QnA: 124 technical question-answering tasks used in the Artificial Analysis composite.
The index averages pass@1 over those three blocks and three runs. It is excellent for comparing coding agents under standard conditions, but it does not directly measure your ERP, your security policy, your test suite, or the quality of a pull request in your repository.
How to read each component Link to heading
Coding Agent Index answers: which agent configuration had the best average completion rate for this trio of scenarios? A score of 80 is not “80% coding quality in general”; it is a compact view of the published pass@1 results for DeepSWE, Terminal-Bench, and SWE-Atlas-QnA.
DeepSWE is closest to a long engineering change: interpreting a short request, exploring an unfamiliar codebase, locating the right surface, and implementing a solution across files. Its 113 tasks were written from scratch in 91 repositories and five languages. A high score is evidence of repository-change ability under that harness, not a guarantee that every PR will be correct. The DeepSWE paper makes the same distinction.
Terminal-Bench 2.1 asks whether an agent can complete real terminal work: compiling, installing, debugging, using scripts, and satisfying a verifier. It is valuable for CLI agents, but says little about architectural analysis or a technical answer without execution. Its 2.1 revision fixed 28 tasks from 2.0 because of unstable external dependencies, insufficient resources, and instructions misaligned with tests. See the 2.1 changes .
SWE-Atlas-QnA measures deep understanding of an existing codebase rather than a code fix. The agent gets a repository in a container, can run the system when needed, traces flows across files, and answers a technical question. It has 124 tasks across 11 production repositories in Go, Python, C, and TypeScript. That makes it useful for investigation, onboarding, and diagnosis. The SWE-Atlas methodology explicitly separates understanding from implementation and refactoring.
Three numbers worth tracking Link to heading
- DeepSWE v1.1: Sol 72.7%, Terra 69.6%, Luna 67.2%.
- Terminal-Bench 2.1: Sol 88.8%, Terra 87.4%, Luna 84.7%.
- Coding Agent Index: Sol 80, Terra 77.4, Luna 74.6.
Terminal-Bench is close enough that cost and workflow may matter more than a 1.4-point gap. DeepSWE opens a larger difference, which fits long engineering tasks: they accumulate dependencies, context, and chances to fail.
One methodological detail changes how the charts should be read: Artificial Analysis measures model + agent + configuration. A Sol result in Codex is not a property of the weights alone; it includes prompts, tools, permissions, execution time, and validation strategy. Change the harness, and the same model can move substantially.
Sol versus Fable, Opus, and Grok Link to heading
In the Coding Agent Index v1.1, Sol at max scores 80, Claude Fable 5 scores 77.2, and Claude Opus 4.8 scores 72.5. The pattern remains in the more operational engineering tests:
- DeepSWE v1.1: Sol 72.7%, Fable 5 69.7%, and Opus 4.8 59%.
- Terminal-Bench 2.1: Sol 88.8%, Fable 5 83.1%, and Opus 4.8 78.9%.
That is strong evidence that Sol is the most capable option in this coding-agent configuration. It is not evidence that it wins every kind of work. On the current Artificial Analysis Intelligence Index v4.1, Fable 5 — with maximum adaptive reasoning and an Opus 4.8 fallback — scores 60; Sol scores 59 at max and 58 at xhigh. OpenAI’s launch table records an earlier snapshot of 59.9 and 58.9, respectively. Sol max is one point behind Fable; Sol xhigh is two points behind. Artificial Analysis’ Sol xhigh versus Fable comparison
and OpenAI’s table
show the different cuts.
Grok now enters the comparison through a new generation. Artificial Analysis’ current profile lists Grok 4.5 at high with 54 on Intelligence Index v4.1, while Sol scores 59 at max and 58 at xhigh. This is a broad index — it combines nine evaluations, including agentic, coding, terminal, and reasoning work — not the Coding Agent Index. Even so, the gap is no longer that of a peripheral model: 4.5 is a frontier alternative worth putting on the shortlist.
This time there is also a coding-agent result: Grok 4.5 in Grok Build scores 76 on the Coding Agent Index, four points below Sol at max (80). Artificial Analysis estimates US$2.49 per task for this run, versus US$5.07 for GPT-5.5 in Codex and US$11.80 for Fable 5 in Claude Code. That is strong efficiency evidence, not an automatic financial win over Sol: each number includes its own model, agent, tools, and execution policy. Grok 4.5 profile
and independent launch analysis
.
The CursorBench counterpoint Link to heading
CursorBench 3.2 supplies another harness: real, ambiguous, multi-file tasks executed by Cursor’s agent. It does not replace DeepSWE, Terminal-Bench, or an internal evaluation, but it is useful for observing how model and effort choices behave elsewhere.
| CursorBench comparison | Score | Average cost per task | Practical reading |
|---|---|---|---|
Sol high × Fable low |
63.5% × 62.1% | US$2.79 × US$4.46 | Sol scores higher at lower cost. |
Terra max × Sol xhigh |
64.9% × 64.5% | US$2.89 × US$3.88 | Terra is a very close, cheaper option here. |
Sol max × Fable max |
67.2% × 70.5% | US$5.69 × US$17.32 | Fable leads, at roughly triple the cost per task. |
Luna high × Luna xhigh |
56.8% × 57.7% | US$0.82 × US$1.14 | For volume, extra effort adds little in this slice. |
Here, xhigh is Cursor’s Extra High level. Costs are API estimates calculated from tokens used in CursorBench, not monthly-plan allowances. Cursor also warns that small differences may not be statistically significant. CursorBench 3.2
.
The contrast with the broad index is instructive. CursorBench puts Terra max slightly ahead of Sol xhigh at lower cost; the broad Artificial Analysis index puts Sol xhigh at 58 versus Terra max at 55. That is not a contradiction. Tasks, weights, agents, and execution prices differ. A benchmark defines a shortlist, not a universal routing policy. Artificial Analysis’ cost-versus-intelligence analysis
.
A migration map for GPT-5.5 users Link to heading
This is a map for orientation, not a task-routing matrix. It shows the lowest-cost GPT-5.6 configuration that matched or exceeded each GPT-5.5 effort level on CursorBench.
| GPT-5.5 | Lowest-cost GPT-5.6 that matches or exceeds it | Score | Cost per task | Saving |
|---|---|---|---|---|
low — 46.6% |
Luna medium |
47.7% | US$0.39 vs. US$0.98 | 60% |
medium — 53.8% |
Luna high |
56.8% | US$0.82 vs. US$1.51 | 46% |
high — 58.4% |
Terra xhigh |
59.2% | US$1.44 vs. US$2.05 | 30% |
xhigh — 58.4% |
Terra xhigh |
59.2% | US$1.44 vs. US$2.85 | 49% |
CursorBench does not list GPT-5.5 at max, so there is no direct equivalent for that level. This table applies to coding tasks in Cursor’s agent. An aggregate index — or your team’s harness — can have different crossover points. CursorBench
and Artificial Analysis comparisons
.
Where cost changes the reading of the scoreboard Link to heading
Sol’s API price is US$5 input and US$30 output per million tokens; Artificial Analysis lists Fable 5 at US$10 and US$50. Cache, response size, tools, and repeated attempts still change the bill. GPT-5.6 pricing and Fable 5’s profile .
On the broad Artificial Analysis index, Sol max reaches about 59 at US$1.04 per task: about one point behind Fable 5 at roughly one third of its cost. That cost-and-score relationship applies to Sol max, not Sol xhigh. In the coding-agent index, the publication estimates Sol in Codex at roughly 40% lower cost per task than Fable 5 in Claude Code and 10% lower than Opus 4.8 in Claude Code. This is more useful than token multiplication because it includes agent behavior, but each model ran in its own native harness.
For Grok 4.5, the distinction between API price and task cost matters even more. Its API costs US$2 input and US$6 output per million tokens, while cache hits cost US$0.50 per million. It is pricier per token than Grok 4.3, but Artificial Analysis reports token efficiency and US$0.31 per task on the broad index. That makes it attractive to test, not an estimate that it will solve your repository for US$0.31: output length, caching, tools, retries, effort, and the chosen agent still change the bill. There is also a factual-reliability caveat: on AA-Omniscience, Grok 4.5’s accuracy rises from 35% to 52% versus 4.3, while its reported hallucination rate also rises from 25% to 54%. External validation remains mandatory for work that depends on reliable facts. Use public scores to build a shortlist; make the budget decision with your own tasks, tool policy, and cost per approved change.
SWE-Bench Pro is deliberately not the main comparison here. Its published score matters — Fable 5 scores 80% versus Sol’s 64.6% — but OpenAI’s audit estimated issues in roughly 30% of the public split. Because that audit comes from one of the compared companies, it is a reason for methodological caution, not a reason to erase the result.
Why production can differ sharply from benchmarks Link to heading
A benchmark answers a controlled question: with this model, this agent, these tools, and these tasks, what was the success rate? Production asks whether the system solves your team’s problem on time, safely, and without creating more work.
Your task distribution contains ambiguous requests, poorly documented business rules, unavailable dependencies, legacy systems, and decisions without an automatic test as referee. The harness also changes everything: system prompt, permitted tools, permissions, search strategy, time budget, test execution, and error recovery. Replacing Codex with another agent or removing write permission can radically alter results.
Success criteria differ too. A benchmark task can pass when its verifier accepts the output. A production change must also respect architecture, security, observability, maintainability, and code review. That is why cost per approved change is a better production metric than token price.
Should you build your own evaluation? Link to heading
Yes — but call it an internal evaluation, not a new market leaderboard. It complements public benchmarks by reproducing the task distribution, context, and acceptance criteria that matter to your product. Google notes that general benchmarks do not measure an AI stack with your own data and criteria; research by Ailem et al. shows that changing case distributions and weights can change model rankings. Google Developers and the robustness study .
Start small with real, safe historical tasks: localized bugs, refactors, implementations with acceptance criteria, primary-source research, structured extraction, and one ambiguous task. Keep a holdout set that is not used to tune prompt or tooling. Record the environment, tools, cost, latency, tests, human intervention, and rejection reason. Re-run whenever you change the model, prompt, permissions, tools, or acceptance criteria.
The cost × intelligence frontier and Terra’s awkward position Link to heading
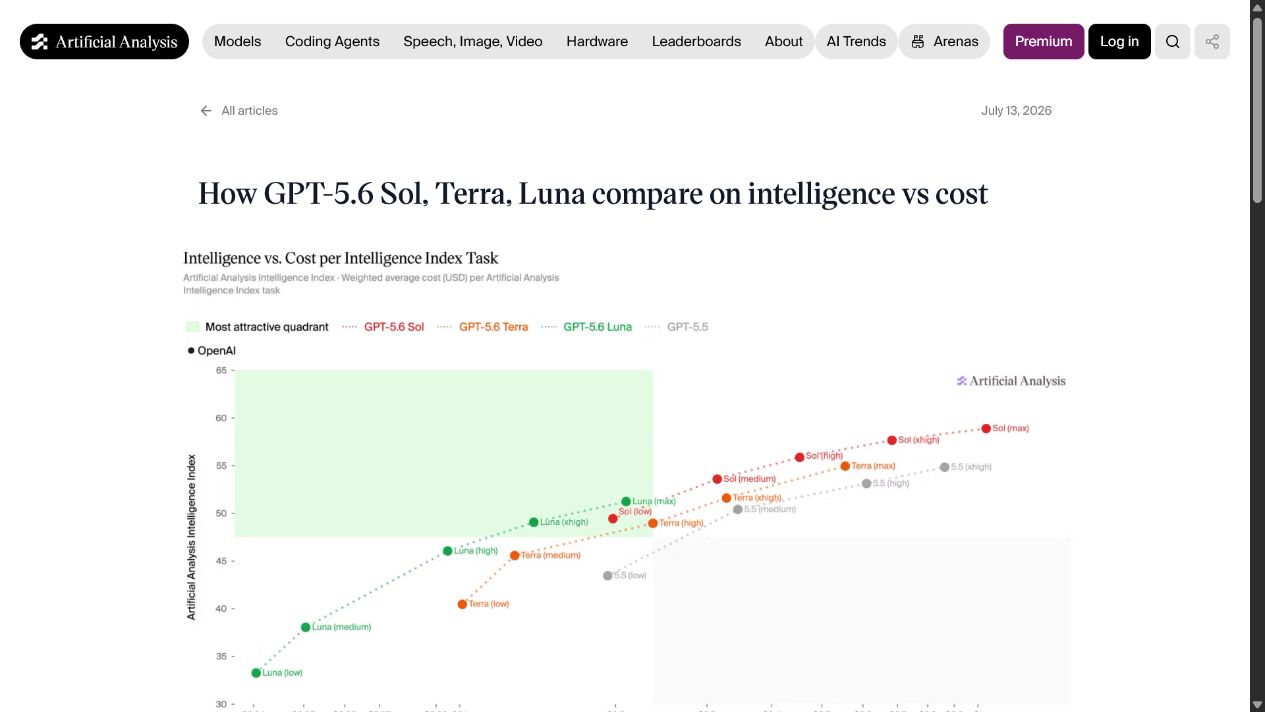
The green area marks the most attractive quadrant for that task set. Source .
The Artificial Analysis Intelligence Index v4.1 combines nine evaluations, weighting agentic work 34%, programming 24%, scientific reasoning 24%, and general capability 18%. It is text-only and English-only. Its aggregate 95% confidence interval is below ±1% in repeated experiments, although individual evaluations can vary more. Methodology .
Sol max scores about 59 at roughly US$1.04 per task; Terra max reaches 55 for about half the cost; Luna max reaches 51 for about 80% less. In that analysis, Sol and Luna sit ahead of Terra at every effort point evaluated: there is a Sol or Luna option with more intelligence at the same cost, or similar intelligence at lower cost. That makes Terra a hypothesis to test, not an obligatory middle step.
It is still not proof that Terra is always worse. Context-window needs, concurrency limits, latency SLAs, governance, and human-approval rates can make an intermediate model the right operational choice.
Where Luna stops being the obvious cheap choice Link to heading
For high volume, triage, classification, structured extraction, and strongly verifiable tasks, Luna is attractive. The risk is assuming that the advantage survives very large contexts or tasks requiring many distant details to remain distinct.
In OpenAI’s MRCR v2 test for recovering eight pieces of information from 256k–512k-token contexts, Sol scores 91.5%, Terra 89.6%, and Luna 41.3%. At 512k–1m tokens, Sol scores 73.8%, Terra 72.5%, and Luna remains at 41.3%. OpenAI’s long-context results .
MRCR means multi-round co-reference resolution: a synthetic conversation includes several nearly identical requests among distractors and asks for the exact occurrence. It measures retrieval and disambiguation under interference, not general architectural understanding. The open MRCR dataset also documents why this is more demanding than finding one obvious needle in a long text.
Initial routing matrix Link to heading
| Situation | Pairs to compare first | Why |
|---|---|---|
| High volume and objective output | Luna: medium, high, or max |
Luna max costs about US$0.21 per broad-index task — roughly 80% less than Sol. Use the lowest effort that passes. |
| Internal automation or routine code | Luna, Terra, or Sol; tune effort | Terra is a candidate, not a mandatory step. SLA, limits, and human review matter. |
| Coding, terminal, and repository agent | Luna, Terra, or Sol at max |
Agent index: Sol 80, Terra 77, Luna 75; Terra and Luna are roughly 60% and 80% cheaper per task. |
| Long context with similar references | Terra or Sol at high or max |
In this MRCR configuration: Sol 91.5%, Terra 89.6%, Luna 41.3%. More Luna effort may be worth testing, but should not be assumed to close the gap. |
| Critical, parallelizable problem | Sol max, then ultra |
ultra coordinates four agents. On Terminal-Bench 2.1, Sol ultra reaches 91.9% versus 88.8% for Sol. |
A starting policy for Codex and ChatGPT Work Link to heading
This matrix refers to Codex and ChatGPT Work, where Plus and higher plans can select Sol, Terra, and Luna. It does not apply to standard ChatGPT conversations, where Terra and Luna are not selectable. Monthly plans are not equivalent to API cost: CursorBench values are per-task estimates in Cursor’s harness. Official GPT-5.6 availability .
| Plan | Daily driver | Difficult tasks | High volume |
|---|---|---|---|
| Plus US$20 | Sol medium |
Sol high; xhigh or Terra max for exceptions |
Luna medium |
| Pro US$100 | Sol medium or high |
Sol xhigh or Terra max |
Luna high |
| Pro US$200 | Sol high |
Sol max |
Luna high |
Plus US$20. Sol medium is the daily driver because it keeps the larger model’s capability for routine work that still has ambiguity, code, or context. Terra high is not selected by reflex: the broad index does not put it on a mandatory efficiency step. Sol high is the default for difficult work. xhigh or Terra max are not absent because Codex/Work cannot run them: they are occasional escalation when the cost of an error is high or Sol high fails validation. This keeps them from consuming the Plus allowance on every difficult request. Luna medium serves high volume because it combines the family’s lowest cost with enough effort for well-specified outputs, classification, transformations, and repetitive tasks.
Pro US$100. For day-to-day work, Sol medium remains the starting point; Sol high enters when recurring human review shows that extra reasoning pays for itself. For difficult work, Sol xhigh is for investigation, debugging, and uncertain requirements; Terra max is the alternative to test when a coding task is repeatable and your harness confirms close quality at lower cost. For volume, Luna high uses part of the extra allowance to reduce errors without carrying Sol’s price and latency into every task.
Pro US$200. Sol high becomes the daily driver because the larger allowance can exchange part of the rework for more reasoning on common requests. Sol max is reserved for difficult work with a high cost of error, confused context, or several technical hypotheses. ultra is absent because it is a parallelism strategy, not a default for every complex task. Luna high remains the high-volume option: a larger plan is not a reason to use Sol in bulk when Luna already passes validation faster and at lower cost.
The matrix follows three observations: the broad index says not to treat Terra as mandatory; the coding-agent index leaves all three max variants as serious candidates; and MRCR plus Sol ultra show that some gaps require more model capacity or parallel orchestration, not merely more effort.
Benchmarks are lighthouses; your evaluation is the road map Link to heading
Benchmarks themselves can fail. In its July 2026 analysis, OpenAI audited the public SWE-Bench Pro split of 731 tasks and reported 200 (27.4%) tasks flagged as problematic by its analysis pipeline and 249 (34.1%) in a human-annotation campaign. Again, it is an audit by an interested participant, so treat it as evidence to investigate rather than a verdict that invalidates every result. The analysis explains the method.
Use three levels of evidence:
- Public benchmarks to build a shortlist.
- A small internal evaluation to test that shortlist in your harness.
- Production telemetry to measure cost per approved delivery over time.
The durable policy is simple:
Use the cheapest model that reliably passes the task’s validations. Increase effort or capacity only when evidence shows that it reduces total delivery cost.
That protects against both wasteful extremes: paying for Sol on trivial volume, and saving money on work that returns as an incident, rework, or an endless review.
References Link to heading
- GPT-5.6 launch, OpenAI
- GPT-5.6 Terra API documentation, OpenAI
- GPT-5.6 benchmarks, intelligence, speed, and cost, Artificial Analysis
- Claude Fable 5 performance and API pricing, Artificial Analysis
- Grok 4.5 performance, pricing, and benchmarks, Artificial Analysis
- Grok 4.5 performance and cost analysis, Artificial Analysis
- Sol
xhighversus Claude Fable 5, Artificial Analysis - Sol, Terra, and Luna: intelligence versus cost, Artificial Analysis
- Coding Agent Index and methodology, Artificial Analysis
- Artificial Analysis Intelligence Index v4.1 methodology
- Terminal-Bench, Laude Institute
- Terminal-Bench 2.1 release notes
- DeepSWE, DataCurve
- DeepSWE paper
- SWE-Atlas Codebase QnA, Scale AI
- OpenAI MRCR benchmark
- CursorBench 3.2
- OpenAI reasoning guide
- Separating signal from noise in coding evaluations, OpenAI
- Google: building application-specific evaluations
- Benchmark robustness under different task distributions
- Google: an agent-quality flywheel